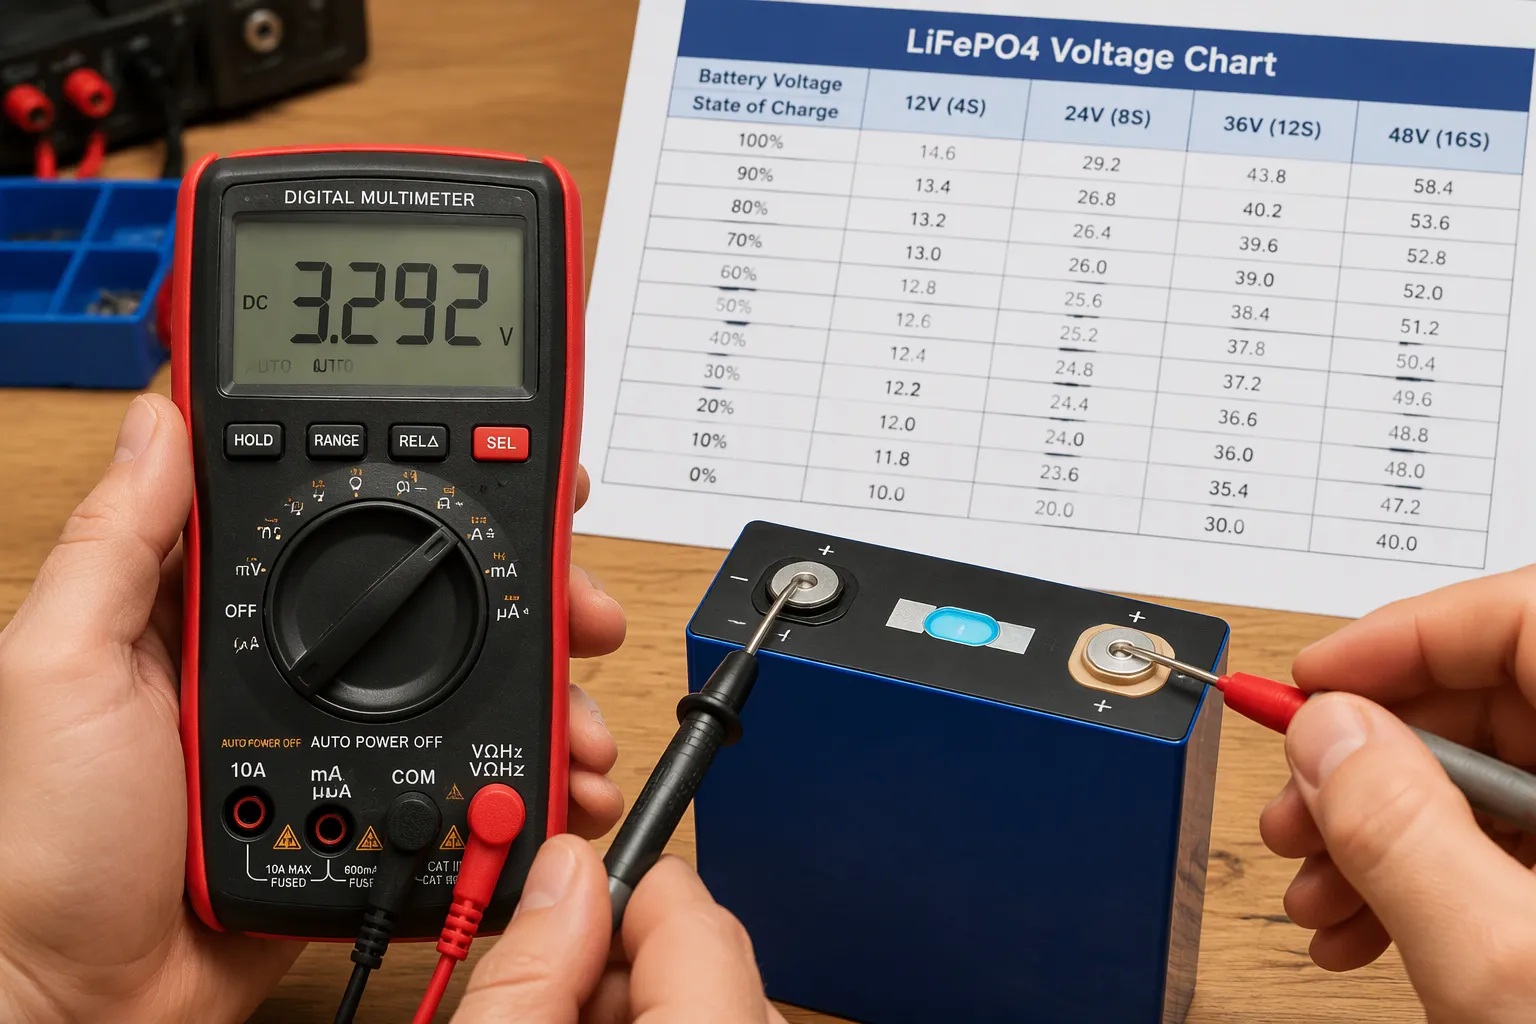
A fully charged 12V LiFePO4 battery rests near 13.4–13.6V, and it drops to about 10V at empty. You scale those numbers for larger packs: ×2 for 24V and ×4 for 48V.
Voltage gives you a useful but imperfect state of charge signal. LiFePO4 holds a nearly flat voltage between roughly 20% and 90%, so mid-range readings tell you less than you expect. You need the right context to interpret them.
This lifepo4 voltage chart guide gives you the full picture. You will see resting voltage values, learn how charging and discharging readings differ, and pick up practical monitoring tips for your battery.
Key Takeaways
-
Measure voltage only after the battery rests for 15–30 minutes. This gives a reliable state of charge reading.
-
Scale the 12V chart: multiply by 2 for 24V, by 3 for 36V, and by 4 for 48V. One chart works for all systems.
-
LiFePO4 voltage stays flat between 20% and 90% state of charge. Mid-range readings are rough estimates, not precise numbers.
-
Ignore voltage readings taken while charging or under heavy load. They mislead you. Use them only as directional signals.
-
For accurate tracking, pair periodic resting voltage checks with a battery monitor or BMS. This keeps your battery healthy and your expectations realistic.
LiFePO4 Voltage Chart and State of Charge
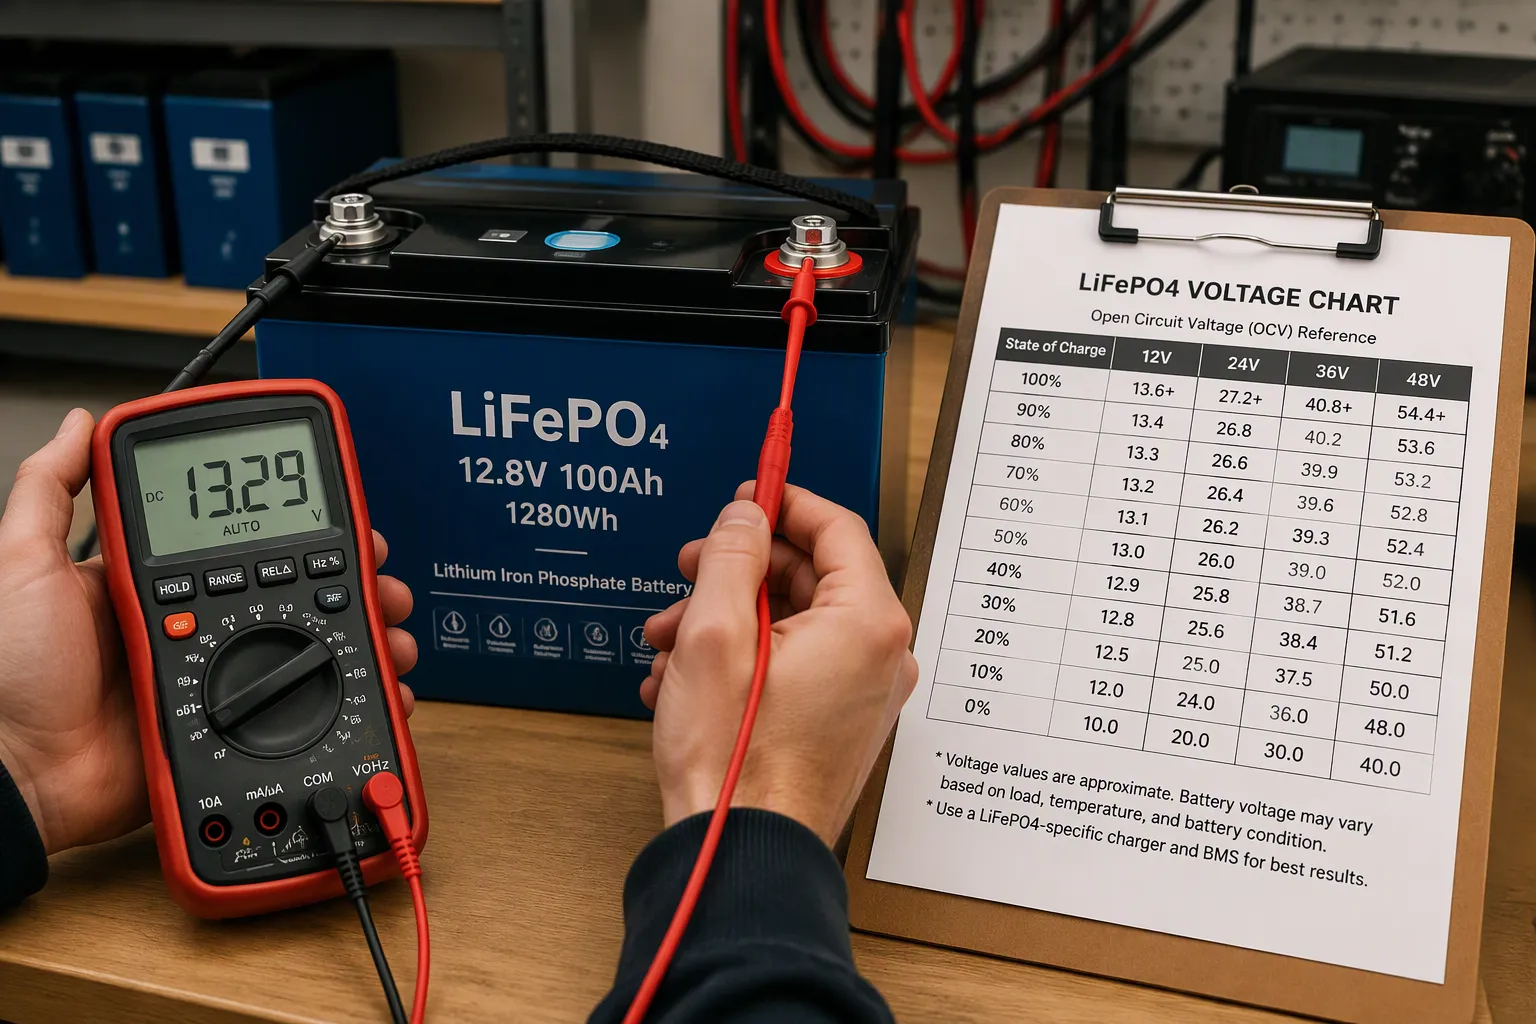
A lifepo4 voltage chart turns a multimeter reading into a usable number. The table below maps resting voltage to state of charge across the system sizes. Each column scales from the same per-cell baseline, so you can read any pack with one reference.
| State of Charge | Per Cell | 12V Pack | 24V Pack | 48V Pack |
|---|---|---|---|---|
| About 90% | ≈3.33–3.35V | 13.3–13.4V | 26.6–26.8V | 53.2–53.6V |
| About 70% | ≈3.30V | 13.2–13.25V | 26.4–26.5V | 52.8–53.0V |
| About 60% | ≈3.29V | 13.15–13.2V | 26.3–26.4V | 52.6–52.8V |
| About 50% | ≈3.28V | 13.1–13.15V | 26.2–26.3V | 52.4–52.6V |
| About 40% | ≈3.27V | 13.0–13.1V | 26.0–26.2V | 52.0–52.4V |
| About 20% | ≈3.20–3.23V | 12.8–12.9V | 25.6–25.8V | 51.2–51.6V |
12V LiFePO4 Voltage Chart
The 12v lifepo4 voltage chart is your baseline. A fully charged 12v lifepo4 battery sits near 13.4V at rest. The 12v lithium battery full charge voltage lands in that same band, which is why the 12v lifepo4 discharge curve looks so flat through the middle.
Sample points make this concrete. You will see roughly 13.2V at 70%, 13.15V at 60%, 13.1V at 50%, and 13.0V at 40%. Notice the small spread. The 12v discharge curve barely moves across that stretch.
24V and 48V Charts
The 24V and 48V charts are simple multiples. Double the 12V value for 24V and quadruple it for 48V. This 12v, 24v and 48v chart logic extends cleanly to other pack sizes as well.
Here is the flat-curve caveat. Between about 90% and 20% state of charge, cell voltage drifts only from roughly 3.35V to about 3.22V. Mid-range readings are therefore approximate. Use the lifepo4 battery percentage from voltage only as a rough guide in that window.
The 3.2v, 12v, 24v & 48v relationship stays consistent because every pack uses the same cell chemistry. That consistency is the real value of these lifepo4 voltage charts. You learn one lifepo4 resting voltage pattern and apply it everywhere. The resting-voltage chart above works for any lifepo4 battery built from standard cells.
LiFePO4 Resting Voltage vs. Charging and Discharging
Why LiFePO4 Resting Voltage Matters
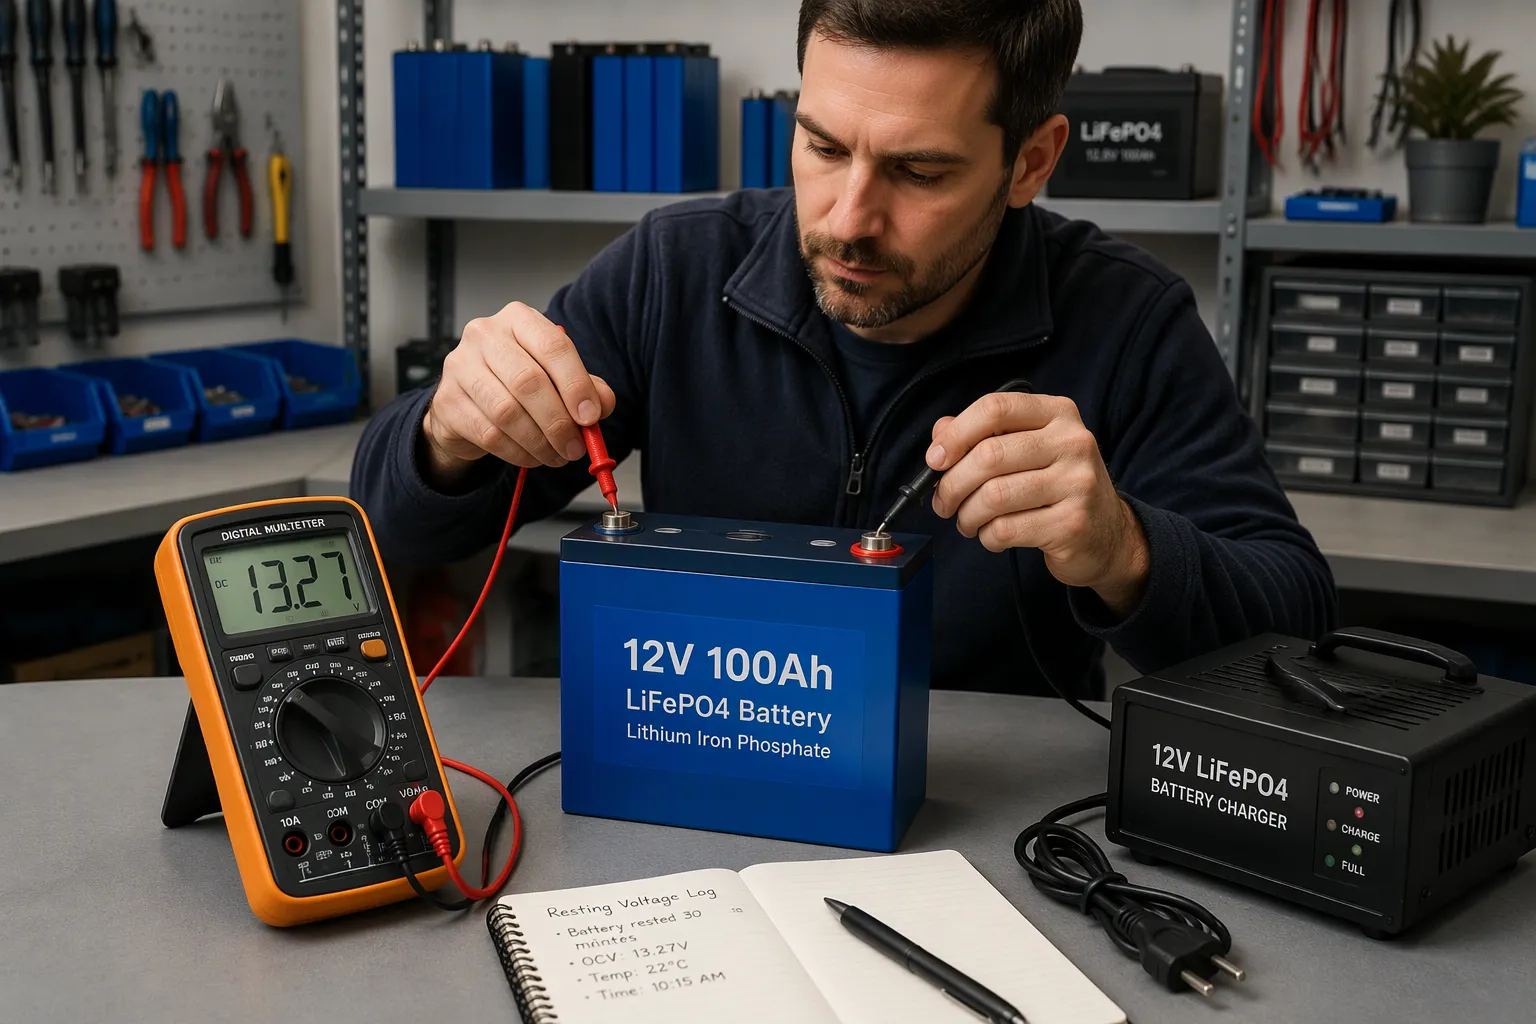
A voltage reading taken while current flows tells you very little about capacity. The only reliable figure for state of charge estimation is the lifepo4 resting voltage, measured after the battery sits idle for a few hours. Current flow pushes the terminal voltage up or down, so a live meter reading reflects load and charger behavior more than stored energy.
How long should you wait? The table below gives practical guidance.
| Rest Duration | Purpose / Accuracy Level |
|---|---|
| 15–30 minutes | Practical minimum; sufficient to dissipate most surface charge after a recent charge cycle |
| 2–4 hours | Precision reading, trustworthy within about 1–2% state of charge |
Before concluding a battery is faulty, let it rest for 30 minutes at room temperature and measure again — this simple step resolves most false “dying battery” alarms.
Treat the lifepo4 resting voltage as your anchor point. Every value on the resting-voltage chart assumes the pack has settled. A fresh reading taken minutes after unplugging a charger will sit high and mislead you.
Charging and Discharging Behavior
Charging follows a two-stage pattern called CC/CV. The charger pushes constant current until the pack reaches the absorption voltage, then holds constant voltage while current tapers. A 12v lifepo4 battery typically uses four cells in series. Charging each cell to 3.65V yields a full-pack top charge of 14.6V. Many users pick a slightly lower absorption setting of about 14.2V to 14.4V to limit time spent at the top of charge. The common absorption range for a 12V pack is therefore 14.2V to 14.6V, with a float range of 13.5V to 13.8V.
| Parameter | Voltage |
|---|---|
| Bulk / absorption (CC→CV target) | 14.2–14.6V |
| Float / standby (if used) | 13.6V |
| Storage (resting, ~50% SOC) | ~13.2V |
| Typical BMS high-voltage cutoff | ~14.8V |
Larger packs scale the same way. For a 48V pack, the charging voltage range is 56.8V to 58.4V. If maximum cycle life is the goal, charging slightly below the highest allowed voltage reduces stress while sacrificing only a small amount of usable capacity. Charging closer to 58.4V suits backup events where runtime matters more than daily longevity.
For a 48V (16S) LiFePO4 pack, the charging voltage range is 56.8V to 58.4V. If maximum cycle life is the goal, charging slightly below the highest allowed voltage reduces stress while sacrificing only a small amount of usable capacity.
During discharge, the opposite happens. Voltage sags below the resting value, and the 12v lifepo4 discharge curve drops faster under heavy load. A fully charged 12v lifepo4 battery may read 13.4V at rest but dip well under 13V while powering a large inverter. Charging and discharging voltages run higher and lower than resting values. Read them as directional signals, not absolute numbers. The lifepo4 voltage chart in the previous section applies only to settled packs. Use live readings to spot trends, and use the lifepo4 resting voltage to judge actual capacity. This habit keeps your lifepo4 batteries healthy and your expectations realistic.
Comparing 12V, 24V, and 48V LiFePO4 Systems
Voltage Scaling Across Systems
One mental model covers all these system sizes. Take any 12V value and multiply it: ×2 for 24V and ×4 for 48V. A 12v lifepo4 battery that rests at 13.4V at full charge corresponds to 26.8V on a 24V pack and 53.6V on a 48V pack. The same rule applies at the bottom of the curve, where a 12V pack reads about 10V at empty.
This scaling works because every pack uses the same 3.2V nominal cells in series. A 12V battery holds four cells, a 24V holds eight, and so on. You learn one lifepo4 resting voltage pattern and apply it to 12v, 24v, and 48v-class batteries without relearning anything. The voltage relationships stay proportional at every state of charge, so a single chart serves your whole fleet.
BMS Cutoff and Load Effects
Each system’s battery management system sets a low-voltage cutoff scaled to its pack size. The cutoff protects the cells from over-discharge, and it trips at a higher absolute number on larger packs. Heavy loads complicate this picture. A large inverter can pull terminal voltage well below the resting value, so live readings during a hard discharge look alarming even on a healthy battery. For multi-cell monitoring architecture, see Texas Instruments’ 36V–48V multi-cell battery management reference design.
Voltage sag misleads you in two ways. It can trigger a premature cutoff, and it can make a half-full pack look empty. Measure at rest whenever you want a true soc estimate. For continuous tracking, install a shunt or rely on the BMS, which counts current rather than guessing from terminal voltage. These tools give you reliable readings on lifepo4 batteries under any load, and they pair well with periodic resting voltage checks.
How LiFePO4 Pack Voltage Is Built From 3.2V Cells
Every LiFePO4 pack is assembled by connecting cells in series to increase voltage. The nominal pack voltage is the sum of the nominal cell voltages. With standard 3.2V LiFePO4 cells, the series count determines the pack’s nominal voltage; parallel connections increase capacity rather than voltage. See our guide to lithium battery series and parallel configurations for the basic connection principles.
12V LiFePO4 Battery
A 12V-class LiFePO4 battery typically uses four cells in series (4S). At 3.2V nominal per cell, the pack has a nominal voltage of 12.8V. Charging to 3.65V per cell gives a maximum charge voltage of 14.6V.
| Nominal pack class | Series configuration | Nominal voltage | Charge voltage (3.65V/cell) |
|---|---|---|---|
| 12V | 4S | 12.8V | 14.6V |
24V LiFePO4 Battery
A 24V-class LiFePO4 battery typically uses eight 3.2V cells in series (8S), producing a nominal voltage of 25.6V. At 3.65V per cell, the corresponding charge voltage is 29.2V. The actual charger settings and BMS limits should always follow the battery manufacturer’s specification.
36V LiFePO4 Battery
A 36V-class LiFePO4 battery commonly uses twelve cells in series (12S). Since each cell has a nominal voltage of 3.2V, the pack’s actual nominal voltage is 38.4V. Charging at 3.65V per cell gives a pack charge voltage of 43.8V. This configuration is used where equipment requires a higher DC bus voltage than a 24V system; the required capacity, discharge current and BMS settings depend on the application. For configurable pack options, see our 36V LiFePO4 battery solutions.
| Nominal pack class | Series configuration | Nominal voltage | Charge voltage (3.65V/cell) |
|---|---|---|---|
| 36V | 12S | 38.4V | 43.8V |
48V LiFePO4 Battery
A common 48V-class LiFePO4 battery uses sixteen cells in series (16S), giving a nominal voltage of 51.2V and a full-charge voltage of 58.4V. This is the configuration reflected in the 48V column of the voltage chart above. Some designs use a different series count, so confirm whether a product is specified as 48.0V (15S) or 51.2V (16S) before selecting a charger, inverter or BMS. Explore 48V LiFePO4 battery systems for system-level configuration options.
| Nominal pack class | Series configuration | Nominal voltage | Charge voltage (3.65V/cell) |
|---|---|---|---|
| 48V class | 16S | 51.2V | 58.4V |
The cell-count calculation is straightforward: multiply the number of cells in series by 3.2V for nominal voltage, or by the cell manufacturer’s specified charge limit for the maximum charging voltage. Texas Instruments’ LiFePO4 design considerations also compares typical cell voltage and charging characteristics across battery chemistries.
LiFePO4 vs NMC Lithium-Ion Voltage Chart
A LiFePO4 cell and an NMC cell look similar on the outside. Their voltage charts do not match. Nominal cell voltage runs 3.20–3.30V for LFP and 3.60–3.70V for NMC. That gap shapes every reading you take from either battery.
| Parameter | LiFePO4 (LFP) | NMC / conventional Li-ion |
|---|---|---|
| Nominal cell voltage | ~3.2V | ~3.6V |
| Charge regulation voltage | ~3.65V | ~4.20V |
The charge side widens the gap. An LFP cell tops out near 3.65V, while an NMC cell charges to 4.20V, with some designs reaching 4.30V. You cannot treat the two chemistries as drop-in equivalents, and the risks run in both directions:
-
A charger or inverter set for NMC limits will overcharge an LFP pack.
-
A system built around NMC nominal voltage may fall outside an LFP replacement’s operating window, and the reverse is also true.
-
Protection setpoints, BMS parameters, and SOC algorithms must differ between the two chemistries.
Pack construction adds another difference. LFP’s lower nominal voltage means a given pack voltage usually needs more LFP cells in series than NMC cells. A 12V-class LFP battery therefore carries a different cell count than an NMC pack of the same label.
The shape of the curve matters most for monitoring. LFP shows a flatter state-of-charge versus open-circuit voltage curve than layered-oxide NMC cells. Voltage alone estimates SOC less reliably on an LFP battery, so coulomb counting with periodic calibration often becomes necessary. NMC voltage moves more across its range, which makes a simple chart reading more informative.
Check the chemistry before you trust any voltage chart. A reading that looks healthy on one battery may signal trouble on the other.
LARGE Battery’s LiFePO4 and Lithium-Ion Battery Cases
These examples show how battery chemistry, cell configuration, voltage, capacity, and mechanical design are matched to different equipment requirements. The first two examples use LiFePO4 cells; the rail drilling machine example uses a conventional 18650 lithium-ion cell platform and is included to illustrate a railway equipment application.ction robots operating in parks and outdoor facilities, with high-current output and a rugged metal enclosure.
1. Medical Equipment Battery Pack
26650 25.6V 6.8Ah LiFePO4 Battery Pack for Medical Equipment
-
Nominal voltage: 25.6V
-
Nominal capacity: 6.8Ah
-
Cell configuration: 26650 · 8S2P
-
Rated energy: 174.08Wh
-
Charging voltage: 29.2V
-
Dimensions: 140 × 136 × 74mm
Designed for home-use and portable medical equipment that requires stable power, compact integration, and multiple protection functions.
Design features: ABS+PC housing, ESD protection, and protection against overcharge, over-discharge, overcurrent, short circuit, and overtemperature. The product page states a discharge temperature range of -20°C to 60°C.
2. Robotics Battery Pack
Product: 26650 48V 40Ah LiFePO4 Battery Pack for Patrol Robots
Designed for patrol and autonomous inspection robots operating in parks and outdoor facilities, with high-current output and a rugged metal enclosure.
-
Nominal voltage: 48V
-
Nominal capacity: 40Ah
-
Cell configuration: 26650 · 15S12P
-
Rated energy: 1,920Wh
-
Charging voltage: 54V
-
Maximum continuous discharge current: 50A
-
Dimensions: 180 × 180 × 140mm
-
Weight: 30kg
Design features: Cold-rolled metal housing, multi-level electrical protection, and a stated discharge temperature range of -20°C to 55°C. This is a 15S, 48V nominal LiFePO4 configuration, not the 16S, 51.2V configuration used in some 48V-class systems.
3. Rail Transportation Battery Pack
Product: 18650 46.8V 13Ah Lithium-Ion Battery Pack for Rail Drilling Machines
Designed for rail drilling machines used in railway construction and industrial field work, where stable output and mechanical durability are required under heavy-load conditions.
-
Nominal voltage: 46.8V
-
Nominal capacity: 13Ah
-
Cell configuration: 18650 · 13S4P
-
Rated energy: 608.4Wh
-
Charging voltage: 54.6V
-
Peak discharge current: 20A
-
Dimensions: 400 × 400 × 100mm
-
Weight: 5kg
Design features: 18650 lithium-ion cells (3.6V nominal per cell), cold-rolled steel housing, internal shock-absorbing structure, and protection against short circuit, overcharge, over-discharge, and overcurrent. This rail application uses conventional lithium-ion chemistry, not LiFePO4.
These examples demonstrate why nominal voltage alone is not enough to define a battery pack. Cell chemistry determines the per-cell voltage range, while series and parallel configuration establish pack voltage and capacity. The final design must also account for load profile, charging limits, operating temperature, enclosure, vibration, protection settings, and equipment interfaces.
For industrial battery safety evaluation, consult the IEC 62619:2022 requirements for industrial lithium batteries and the applicable UL 1973 battery system standard. Applicable standards depend on the battery’s intended use and the equipment-level certification scope.
Practical Voltage Monitoring Tips
Temperature and Meter Accuracy
Temperature changes battery voltage in predictable directions. Cold weather pulls voltage down and raises internal resistance. Warm conditions push it slightly higher. The ideal operating window for lifepo4 batteries sits around 20°C to 40°C (68°F to 104°F). Charging below 0°C (32°F) needs caution to prevent lithium plating, and most BMS units adjust charge parameters by temperature.
A quality meter improves accuracy too. A cheap multimeter can drift enough to blur the small gaps in the mid-range curve. Measure a 12v lifepo4 battery with a trusted meter, and note the ambient temperature beside the number. A fully charged 12v lifepo4 battery read in a cold garage will look weaker than it is. Record conditions with each check so later comparisons stay fair.
Common Voltage Reading Mistakes
Several habits distort your state of charge estimate. Watch for these common errors:
-
Measuring while the battery still sits on a charger, which inflates the reading above true resting voltage.
-
Measuring under a heavy load, since current draw drags voltage down and it recovers later.
-
Treating chart percentages as precise values instead of rough estimates.
-
Applying one cutoff to every pack, when manufacturer and BMS limits differ.
-
Ignoring temperature, which alters behavior in heat and cold.
Use the chart for a quick check only. Rely on BMS data or a battery monitor for accurate tracking. Learn how to check voltage properly: let the pack rest, then compare the number to the chart for your system. A lifepo4 resting voltage taken after a few idle hours beats any live reading. That single resting voltage tells you more than a dozen loaded readings. Voltage sag under load misleads even experienced users. A settled curve rewards patience. Compare that voltage to the chart, and log it. This habit sharpens your soc tracking over time and keeps a stored battery honest.
Your core rule stays simple. Read resting voltage after the pack sits idle, then match that number to the lifepo4 voltage chart for your system size. Treat readings taken while charging or discharging as directional signals, not absolute truth. At 50% state of charge, a cell rests near 3.28V, so a 12v lifepo4 battery shows about 13.1V.
The 24V and 48V charts are simple multiples of the 12V baseline. One mental model therefore covers all these battery systems. Trust that resting voltage over live readings. For the most reliable soc tracking, pair periodic voltage checks with a shunt or BMS on your lifepo4 batteries. That combination keeps every battery honest.
FAQ
What resting voltage shows a full charge on a 12V LiFePO4 battery?
A full 12V lifepo4 pack rests near 13.4–13.6V. Read it after the battery sits idle, since a fresh charger reading runs high. A pack at about 10V is empty.
Why does my fully charged battery read lower than expected?
Cold temperatures pull voltage down. A heavy load drags it down too. Let the pack rest 15–30 minutes at room temperature, then measure again. Most low readings come from surface charge or load sag, not a weak battery.
How long should I let the battery rest before I measure voltage?
Wait at least 15–30 minutes after a charge cycle. For a precision reading within about 1–2% state of charge, let the lifepo4 battery rest 2–4 hours. Patience gives you a trustworthy number.
Do the 12V voltage numbers scale to 24V and 48V packs?
Yes. Multiply the 12V value by 2 for 24V and by 4 for 48V. Every pack uses 3.2V cells in series, so one chart covers all these systems. A 48V charge tops out near 58.4V.
Why does my meter disagree with my BMS reading?
Your meter reads terminal voltage at one moment. The BMS counts current over time and tracks the whole charge cycle. Under load, voltage sags and the meter looks low. Trust the BMS for state of charge, and use resting voltage as a periodic check.